
22.08.2026

Yelyzaveta Zorenko
Author
Most people start looking up “how to increase ROI” at the exact moment their tracker stops agreeing with their bank account. The dashboard says the campaign is up. The affiliate program pays less than the rate card implied. Then accounts, proxies, tracker fees and the buyer’s profit share take another bite, and what looked like a healthy margin has shrunk to a third of itself.
That gap is rarely a traffic quality problem. It is a measurement problem, and it is fixable in a week or two without touching a single creative. What follows is the whole chain: how to calculate affiliate ROI so the number survives contact with reality, what the advertiser deducts before you ever see a payment, how long a revenue share cohort takes to pay back, and which levers actually move the number. Every figure carries a source, and anywhere a market estimate stands in for a verified fact, it says so.
What you are actually measuring
Before raising a number, agree on which number you are raising. The word ROI covers three different figures in this industry, and on a single campaign the spread between them runs to forty points.
The formula trackers actually use
Keitaro’s own glossary carries two versions. ROI (all) is ((income from lead conversions + income from sale conversions) – cost) / cost * 100. ROI (confirmed) counts sale conversions only, which in iGaming means confirmed deposits. Voluum’s documentation gives one formula: (total revenue – total cost) / total cost * 100%. Binom’s documentation gives the same arithmetic: (revenue – costs) / costs * 100%, alongside CR, CTR and LP CTR. All three major trackers land on one formula.
Here is the detail almost every guide skips. Under that formula break-even sits at 0%, not 100%. And Keitaro contradicts itself on exactly this point: its blog states, word for word, that “100% ROI is a break-even point.” That is the ROAS scale wearing an ROI label. One vendor, one product, two incompatible definitions. Before you compare your result to somebody’s case study, check which scale their number lives on.
Gross, Net and Cash ROI
Splitting the metric into three layers settles most arguments about whose figure is correct.
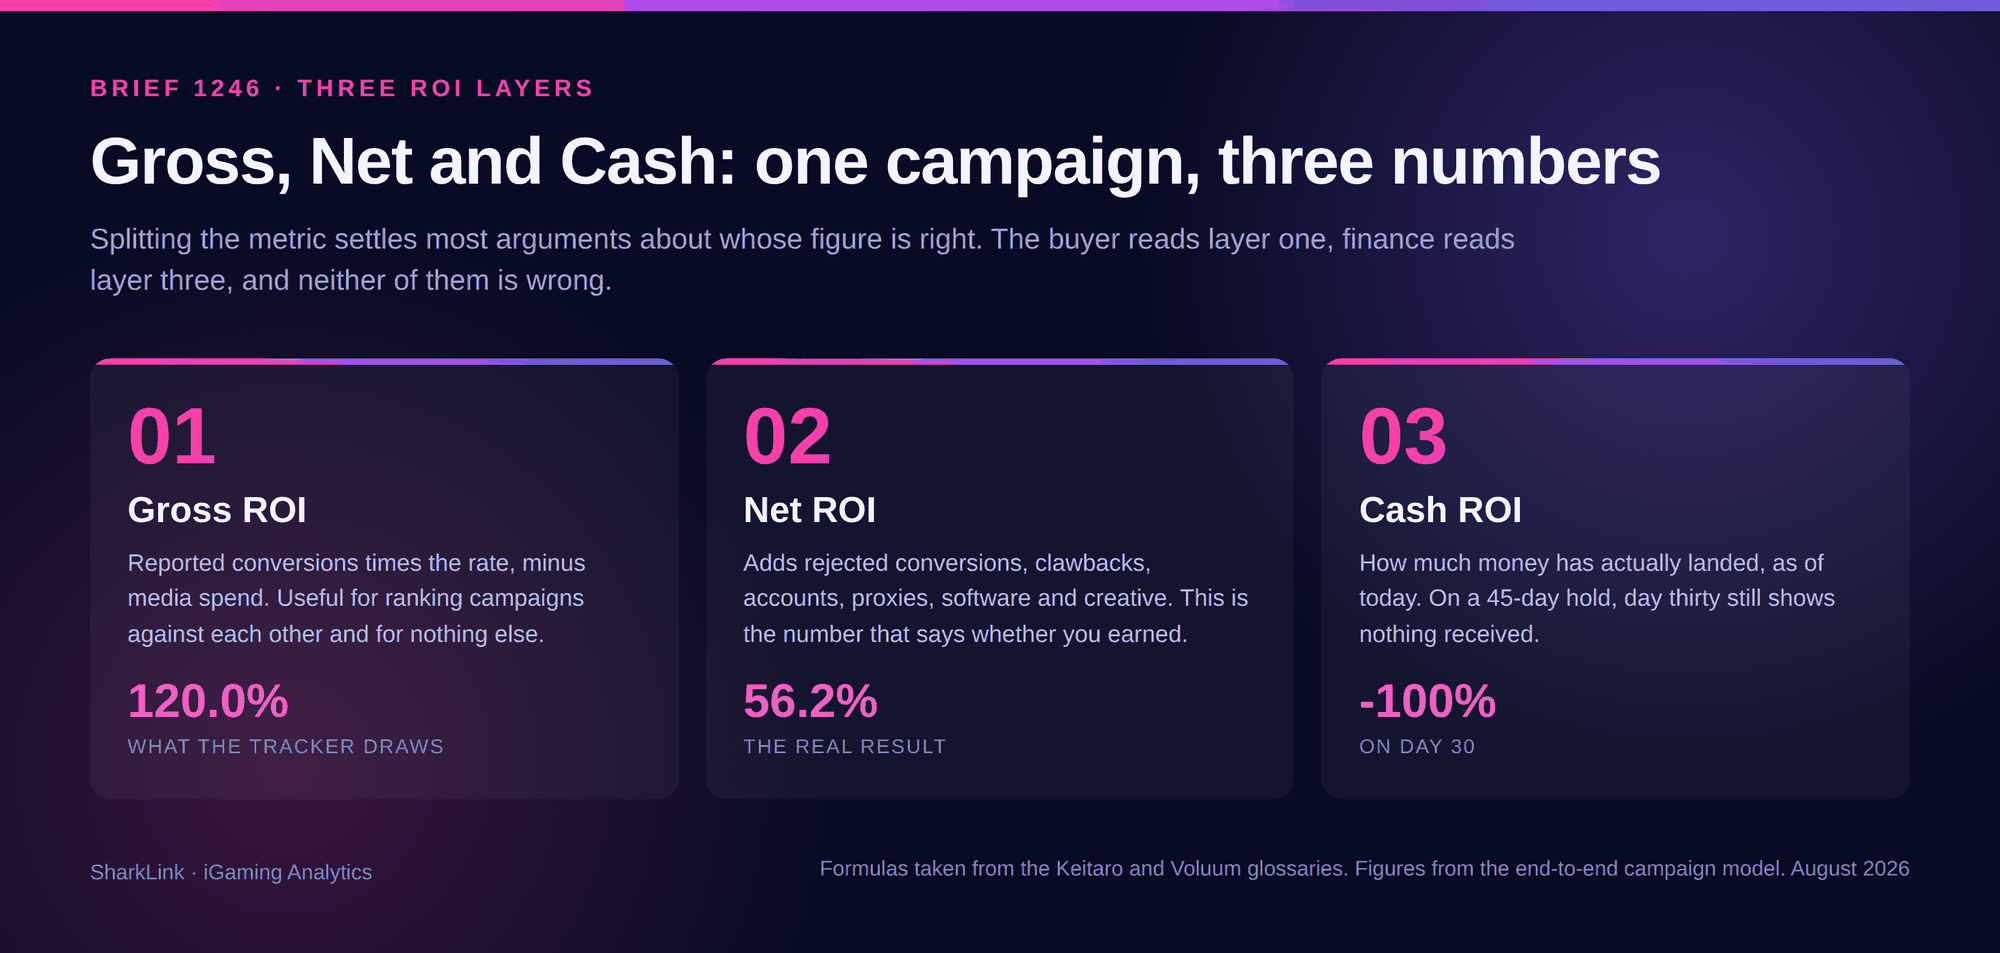
Gross ROI is what the tracker draws: reported conversions times the rate, minus media spend. It is useful for ranking campaigns against each other and for nothing else.
Net ROI absorbs everything the tracker cannot see, from rejected conversions and clawbacks to accounts, proxies, software and creative production. This is the figure that answers whether the campaign made money.
Cash ROI answers a different question: how much money has actually landed, as of today. On a 45-day hold, Cash ROI on day thirty is minus one hundred percent even when Net ROI for the same campaign is 56%.
None of the pages currently ranking for this topic in English, Ukrainian or Russian separate these layers. That omission is why a media buyer and a finance lead on the same team can argue about profitability and both be right.
ROI, ROAS and ROMI on one data set
Take a campaign with 10,000 USD of media spend and 22,000 USD of reported revenue, with another 1,900 USD spent on tooling and creative.
| Metric | Formula | Value | What it tells you |
|---|---|---|---|
| ROAS | Revenue / ad spend | 2.2x (220%) | Revenue produced per dollar of media budget |
| ROMI | (Revenue – marketing) / marketing * 100 | 120% | Marketing return before operating costs |
| Gross ROI | (Revenue – spend) / spend * 100 | 120% | Ceiling estimate, before any deduction |
| Net ROI | (Adjusted revenue – all costs) / all costs * 100 | 56.2% | What the campaign actually returned |
RedTrack admits the confusion openly in its own material and sets working thresholds of 4:1 on ROAS and above 100% on ROI. Industry analysts writing in Russian put it more bluntly: in affiliate case studies, the figure presented as ROI is very often ROAS. The distinction matters. A 220% ROAS is a modest profit; a 220% ROI on the same spend is three times that.
The costs your tracker never sees
Your tracker knows exactly one cost line: whatever you typed into the campaign’s cost field. Everything else lives in spreadsheets, supplier chats and payment statements, which is why it rarely reaches the ROI calculation.
Media costs outside of spend
Payment processor fees on ad account top-ups, FX spread on conversion, stranded balances on banned accounts, overdraft. Across a quarter this reliably adds 2-5% on top of declared spend. We covered how to work each of these lines down in a separate piece on cutting media buying costs. Account supply is a separate line: an industry breakdown published 20 June 2026 puts high-trust Facebook accounts with a business manager at 7-10 USD, rental at roughly 25 USD per ten days, and supporting infrastructure starting at 50-80 USD.
What a 2026 stack costs
Tracker pricing below comes from each vendor’s own pricing page as of 5 August 2026.
| Product | Entry tier | Top tier | What limits it |
|---|---|---|---|
| Keitaro | EUR 40/mo (Starter) | EUR 400/mo (Enterprise) | Seats and domains |
| Binom | 149 USD/mo (v2 self-hosted) | 299 USD/mo (Cloud) | Clicks per day, no overage fees |
| RedTrack | 69 USD/mo (Builder, 2M events) | 833 USD/mo (Enterprise, 75M) | Event volume |
| Voluum | 119 USD/mo (Profit, 1M events) | 7,999 USD/mo (Executive, 500M) | Events plus 0.03-0.06 USD per 1,000 over cap |
| Cloaking service | 10 USD/mo (Axetra, Bhole) | from 1,000 USD/mo (Kaminari) | Traffic volume and filtering depth |
A working iGaming stack means tracker, cloaker, antidetect browser, proxies and domains: 350-600 USD monthly before a single dollar reaches an ad auction. Voluum at 25 million events runs 799 USD, so past roughly 20 million clicks the choice of tracker becomes a budget line rather than a preference.
Team and creative
A buyer’s profit share is not a cost under the textbook ROI formula, yet it determines what reaches the person funding the campaign. In the worked example running through this article, a 25% profit share pulls the capital owner’s ROI from 56.2% down to 36.9%. Teams are better off tracking two numbers side by side: campaign ROI and capital ROI.
“The most common calculation error we see among partners is that spend gets counted to the cent while everything else gets rounded to zero. Accounts, proxies, cloaking and creative together add 15-20% in costs. A campaign showing 18% ROI in the tracker turns out to be underwater once you include them, and the team finds out two months later, when the hold expires,” says the SharkLink team.
What the advertiser deducts before you get paid
The other half of the tracker-to-bank-account gap sits on the program’s side. The mechanics are transparent enough, provided you read the terms rather than the rate card.
Admin fee: how 40% becomes 30%
An admin fee is the operator’s deduction for its own costs, applied before your percentage. Almost no public contract states one numerically, but practitioners have broken the structure down. A working affiliate laid the structure out on the GPWA forum back in August 2021: 12-17% for game content, 3-6% for payment processing and a further 7-10% platform charge where the brand runs on white label. That comes to roughly 25%, which the poster called typical. Four years on the benchmark has not moved: a fresh 2025 thread on the same forum repeats the same arithmetic unchanged.
The arithmetic from the same thread: a headline 40% revenue share under a 25% admin fee pays out as an effective 30%. Affiliates do not agree among themselves either. In one August 2025 thread, one poster claims a 30% admin fee has become the industry standard; another replies that every program he works with charges 10%.
What comes out of NGR
Revenue share is calculated on Net Gaming Revenue, not on what the player lost. GambleOn’s public affiliate terms itemise the deductions explicitly: licensing fees, payment processing fees, software and game royalties, jackpot contributions, verification costs, chargebacks, refunded transactions and any amounts attributable to fraud.
Run it on a cohort producing 50,000 USD of monthly GGR. The percentages come from the GPWA breakdown and are presented as a working model, not as any specific program’s terms.
| Line | Amount, USD | Remaining |
|---|---|---|
| Cohort GGR for the month | 50,000 | 50,000 |
| Bonuses, free spins and cashback, 20% | -10,000 | 40,000 |
| Payment processing, 5% | -2,500 | 37,500 |
| Content provider royalties, 14% | -7,000 | 30,500 |
| Jackpot contributions, 2% | -1,000 | 29,500 |
| Chargebacks and refunds, 1.5% | -750 | 28,750 |
| NGR | 28,750 | |
| Revenue share at 40% of NGR | 11,500 |
A headline 40% applied to GGR would have paid 20,000 USD. The actual payout is 11,500, an effective 23% of player turnover, which is close to half the rate on the banner. Nothing here breaks the contract. It is the NGR formula read literally.
Rejections, clawbacks and holdbacks
Track360 published commission benchmarks drawn from twelve months of anonymised cross-program data covering Q3 2025 through Q2 2026. It is the only market-wide data set we found with a disclosed sample.
- Holdbacks run 5-15% of the payable amount and are released after traffic quality review.
- The clawback window, during which credited conversions can be reversed, runs 30-90 days from crediting.
- Median casino CPA sits at 250 USD on Tier-1, 120 USD on Tier-2 and 50 USD on Tier-3.
- Median casino revenue share is 30% of NGR across a 25-45% range.
- Roughly 45% of new Tier-1 deals are hybrids: a reduced CPA of 75-150 USD plus 15-25% revenue share.
GambleOn’s terms show how long the timelines can stretch in a real contract: final payments withheld for up to ninety days, a EUR 300 payment threshold with the balance carried forward, and settlement within thirty days of receipt.
Negative carryover
From those same terms: a No Negative Carry Over policy applies to revenue share and to the revenue share element of hybrid deals, and where Net Revenue is negative in a calendar month, commission for that month is zero. Note the asymmetry. The loss is not passed to you, but it is not made up to you either. A negative month simply drops out.
Where no such policy exists and losses do carry forward, it costs real money. Track360 works a five-month example: January produced 5,000 USD of NGR and a 1,500 USD payout, February came in at minus 3,000 and April at minus 8,000, and the period settled at 3,900 instead of the 4,500 it would have paid without carryover. A 16 June 2026 review of fifteen gambling programs found that only three publicly confirm a no-carryover policy, with the rest undisclosed. Ask about it before you sign, not after a bad month.
Shaving: why no real number exists
Time for an uncomfortable admission. We checked English, Ukrainian and Russian sources, trade media, affiliate forums and ad network material. Nobody publishes a measured shaving rate for gambling programs. Every article explains the mechanism; not one discloses a sample or a method. Any specific percentage you see quoted is the author’s guess dressed as data.
What to do about it in practice: shaving is not proven by a percentage, it is detected as a divergence. Keep your own postback counter, reconcile expected against reported daily, and treat a gap above 15-20% as grounds for a conversation. A sharp approval-rate drop timed precisely to your campaign reaching volume is the single most telling signal.
The ROI waterfall: 120% in the tracker, 56% in the bank
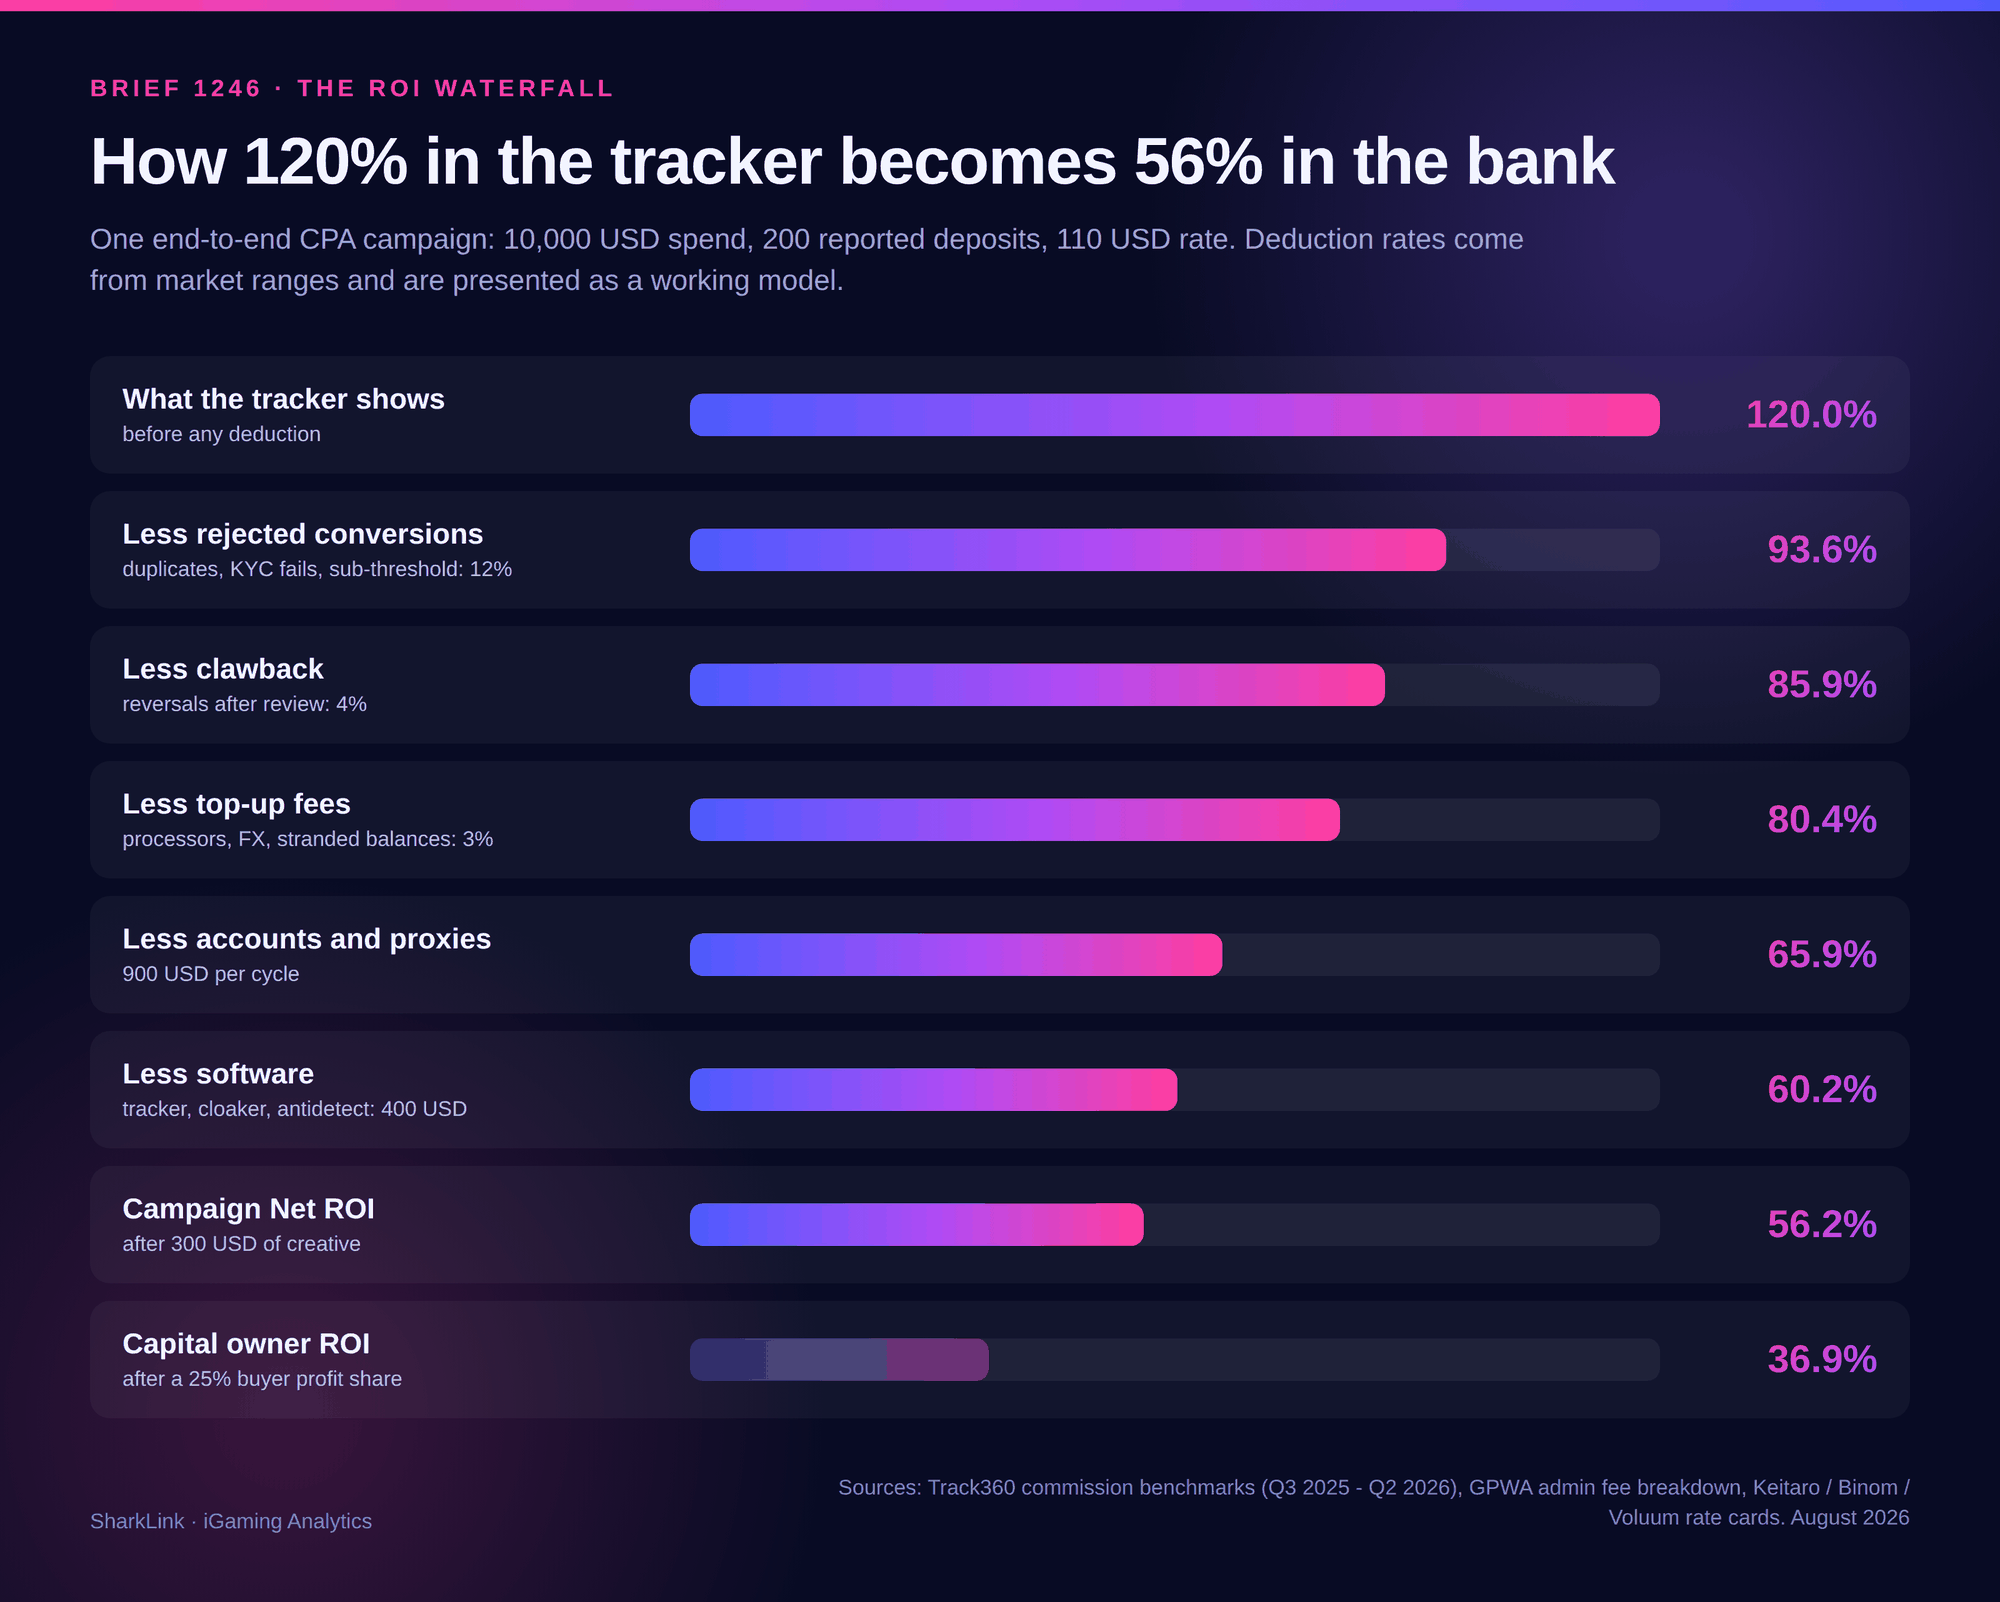
Now put it all on one campaign. Inputs: Facebook, a Tier-2 casino offer, CPA at 110 USD, 10,000 USD spend, 200 reported deposits. Deduction rates are drawn from the ranges above and presented as a working model.
| Step | What gets cut | Revenue, USD | Cost, USD | ROI |
|---|---|---|---|---|
| Tracker | nothing | 22,000 | 10,000 | 120.0% |
| Rejected conversions, 12% | duplicates, KYC failures, sub-threshold deposits | 19,360 | 10,000 | 93.6% |
| Clawback, 4% | reversals after review | 18,586 | 10,000 | 85.9% |
| Top-up fees, 3% | processors, FX, stranded balances | 18,586 | 10,300 | 80.4% |
| Accounts and proxies | 900 USD per cycle | 18,586 | 11,200 | 65.9% |
| Software | tracker, cloaker, antidetect: 400 USD | 18,586 | 11,600 | 60.2% |
| Outsourced creative | 300 USD | 18,586 | 11,900 | 56.2% |
| Buyer profit share, 25% | 1,671 USD of net profit | 18,586 | 13,571 | 36.9% |
More than half of the headline result evaporates on steps that have nothing to do with traffic quality. Rejected conversions do the heaviest single damage at minus 26 points of ROI in one line. Accounts and infrastructure come second at minus 14.
The practical takeaway: a CPA campaign showing Gross ROI below 40% is almost certainly underwater once fully costed, and scaling it will only lose money faster, however good the dashboard looks.
Hold periods and capital turnover
ROI says nothing about time. Yet money frozen in a hold cannot be deployed again, and the number of deployments per year is what determines annual earnings.
Counting cycles
A full capital cycle is the program’s hold period plus the time conversions accrue before the settlement date, which on monthly settlement adds roughly another 15 days. The monthly volume your bankroll supports works out to bankroll * 30 / cycle length in days.
Why 35% at a 7-day hold beats 60% at 45 days
| Parameter | Campaign A | Campaign B |
|---|---|---|
| Campaign Net ROI | 60% | 35% |
| Program hold | 45 days | 7 days |
| Full capital cycle | 60 days | 22 days |
| Bankroll | 10,000 USD | 10,000 USD |
| Monthly spend the bankroll supports | 5,000 USD | 13,636 USD |
| Monthly profit | 3,000 USD | 4,773 USD |
The campaign with barely half the ROI returns 59% more money on the same bankroll. That is why payment terms belong next to the rate in a negotiation rather than as an afterthought. Cutting a hold from 45 days to 14 will typically add more income than winning five points of revenue share.
Cohort payback modelling for revenue share
CPA pays now; revenue share pays over years. Better Collective’s 2024 annual report quantifies the scale of that shift: the US market’s move from upfront payments to revenue share built an accumulated customer lifetime value base of more than EUR 155 million across two years, of which roughly EUR 120 million had not yet been recognised as revenue. More than three quarters of what was earned sat in the future.
The cohort grid, in money
Model inputs: 100 FTDs on Tier-2, acquisition cost of 100 USD per deposit (10,000 USD spend), 30% revenue share of NGR, 45% first-month retention. These are market-range assumptions, not any program’s actual data.
| Month | Active players | Cohort NGR, USD | Payout, USD | Cumulative, USD | Cumulative ROI |
|---|---|---|---|---|---|
| 1 | 100 | 12,000 | 3,600 | 3,600 | -64.0% |
| 2 | 45 | 4,950 | 1,485 | 5,085 | -49.1% |
| 3 | 30 | 3,150 | 945 | 6,030 | -39.7% |
| 6 | 17 | 1,700 | 510 | 7,860 | -21.4% |
| 9 | 12 | 1,240 | 372 | 9,105 | -8.9% |
| 12 | 9 | 900 | 270 | 10,011 | +0.1% |
| 18 | 5 | 530 | 159 | 11,150 | +11.5% |
| 24 | 3 | 280 | 84 | 11,755 | +17.5% |
Break-even lands in month twelve. Two years in, the cohort returns +17.5%. The same hundred deposits taken on CPA at the Tier-2 median of 120 USD would have paid 12,000 USD on the crediting date, which is +20% immediately.

When revenue share wins anyway
That model assumes average retention. Rush Street Interactive’s published LTV curve shows how differently regulated markets behave: across its US and Ontario cohorts, player value climbs from near zero to over 4,000 USD by month 48 and approaches 5,200 USD after five or more years. With a tail like that, revenue share beats any CPA several times over. Three conditions have to hold, mind you: the brand retains players, the GEO can afford to play, and you can wait years.
The working rule: revenue share makes sense when you can fund at least twelve months of operations without that money. If your bankroll needs to turn over, a hybrid with a reduced CPA and a modest revenue share component will produce a better result over the same window.
How much data before the ROI number means anything
The costliest media buying mistake is not a failed test. It is switching off campaigns that were profitable all along. A decision made on twenty deposits is a coin flip, and arithmetic proves it.
Conversion counts carry a relative error of roughly 1 / √n. At a 95% confidence level that error is 1.96 / √n. Because ROI scales linearly with FTD count at fixed spend, the same error transfers directly onto ROI.
| FTDs | Relative error | How a measured 30% ROI should be read |
|---|---|---|
| 10 | 31.6% | anywhere from -51% to +111% |
| 20 | 22.4% | anywhere from -27% to +87% |
| 50 | 14.1% | anywhere from -6% to +66% |
| 100 | 10.0% | anywhere from +5% to +56% |
| 200 | 7.1% | anywhere from +12% to +48% |
| 385 | 5.1% | anywhere from +17% to +43% |
Read it this way. At twenty deposits a measured 30% ROI is statistically indistinguishable from a 27% loss, because both sit inside the confidence interval. You need somewhere around fifty deposits before you can call a campaign profitable with any confidence, and a hundred before you can plan a scale-up against a specific ROI figure. Five percent precision takes roughly four hundred conversions.
The consequence for test design is straightforward. If your budget only reaches 20-30 deposits, that test answers “does this angle convert at all,” not “what is its ROI.” Those two questions cost different amounts of money.

Where ROI leaks in the funnel
The gap between your numbers and the program’s numbers is often not shaving at all, but different denominators. The operator measures conversion from a completed registration inside the product. You measure it from a cold click.
| Funnel step | Operator benchmark | Cold paid affiliate traffic |
|---|---|---|
| Landing to registration start | 20-40% | lower, source dependent |
| Registration start to completion | 50-70% | lower, incentivised traffic drags it down |
| Registration to first deposit | 30-50% | 3.3-5% |
| End to end, visit to FTD | 2-5% | 0.2-1% on push |
Operator figures come from a casino funnel analysis published 3 June 2026; the affiliate figures come from a vertical breakdown dated 9 February 2026 and updated 1 July 2026, where the typical ratio is described as 20-30 registrations per deposit. Both sets are correct within their own scope, which is precisely why they cannot share a column without explanation.
Invalid traffic
TrafficGuard’s audit of Google Search campaigns across more than a hundred sports betting operators reported invalid traffic at 44% for Tier 1 operators, 29% for Tier 2, 42% for Tier 3 and 33% for Tier 4. It also found that 76.8% of all traffic to operator sites came from returning users. Two caveats belong with that number: the vendor disclosed neither the analysis window nor total ad spend, and it sells invalid traffic protection. Its method also blends bots with non-incremental visits, so treat 44% as a ceiling estimate rather than an industry norm.
ROI levers, ranked by how fast they pay
Lists of ten tips like “test your creatives” are useless because they rank nothing by impact or by time to effect. What follows is ordered on both: levers that move the number within a week first, quarter-long plays last.

Contract levers, effect in 1-2 weeks
The cheapest way to raise ROI, since it costs neither budget nor test spend.
- Negotiate a cap on negative carryover, or no carryover at all. On Track360’s worked example that is the difference between 3,900 and 4,500 USD across five months, roughly 13% of income lost.
- Shorten the hold. Moving from 45 days to 14 roughly doubles monthly bankroll turnover at unchanged campaign ROI.
- Get the admin fee stated as a number in the agreement. On a 40% headline rate, 10% versus 30% is the difference between an effective 36% and 28%.
- Ask for volume-triggered bumps instead of a one-off rate rise: a 25/30/35/40% grid tied to monthly NGR tiers runs itself.
- Raise a hybrid switch if your bankroll needs to turn over. Reduced CPA of 75-150 USD plus 15-25% revenue share already accounts for around 45% of new Tier-1 deals per Track360.
- Pin down the clawback window. Thirty days instead of ninety cuts frozen income by two thirds.
Media levers, effect in 1-4 weeks
- Widen the creative pool. Meta, quoted in AppsFlyer’s creative report, put its own Advantage+ Shopping data at a 29% lower median incremental cost per purchase for campaigns running 20 or more creatives, with mixing video, static and catalogue formats adding roughly 5% more. Those are e-commerce numbers, so treat them as direction rather than as an iGaming benchmark.
- Keep frequency under 2.5. Between 2.5 and 4.0, CPM rises 15-30%; between 4.0 and 6.0, it rises 35-60%; above 6.0 it can triple.
- Refresh ads at the 10-14 day mark, or when CPA reaches 140% of baseline.
- Change one variable per test: creative first, prelander second, landing page last.
- Split GEOs and placements into separate flows. Tier-1 and Tier-3 in one report hide both results.
Product and analytics levers
Slower to land, but they do not roll back. Choosing a brand on retention rather than on headline rate reshapes the entire cohort curve: at identical CPA, a brand with better retention roughly doubles the revenue share tail. Cashier localisation and locally relevant payment methods feed straight into deposit conversion, while verification friction is estimated to cost 30-50% of would-be depositors in poorly designed flows.
On the analytics side the minimum viable setup is server-to-server postbacks rather than pixels, conversion deduplication, and identical attribution windows on your side and the program’s. The SharkLink affiliate program catalogue is organised for exactly that comparison, with terms, payout models and payment methods visible side by side rather than scattered across dozens of sites.
What traffic costs in 2026, and what ROI it can carry
Entry cost per channel sets the ceiling on achievable ROI. Figures below are current as of August 2026, taken from network rate cards and industry benchmarks; for the offers themselves, see our review of the strongest arbitrage offers this year.
Paid social
Meta CPM rose 10% year over year in Q2 2026, the sharpest increase since Q1 2022. Facebook accounted for 13% of that; Instagram was flat. The revealing detail: advertiser spend on Meta grew 11% while impressions grew only 2%. Tinuiti’s sample covers anonymised US campaigns with more than 4 billion USD in combined annual spend.
No public gambling-specific Meta CPM exists for 2026, and any article quoting one is either recycling 2023 data or estimating. The closest usable proxy is the finance vertical: CPM 18.56 USD, CPC 3.89 USD, CPA 164.28 USD on Q1 2026 medians.
TikTok’s global median CPM is 8.50 USD across a 4-25 range, with CPC at 0.85 USD and CPA at 35 USD. By country, ranges beat point estimates: US 6-12 USD, UK 5-10, Germany 4-8, Brazil 2-4, India 1-2.
Push, pop and Telegram
| Channel | Entry bid | Minimum deposit | Note |
|---|---|---|---|
| Classic push (RichAds) | CPC from 0.005 USD | 150 USD | The network’s own FAQ quotes 0.003 USD; confirm with your manager |
| In-page push | CPC from 0.005 USD | network dependent | Sidesteps subscription limits |
| Popunder | CPM from 0.50 USD on Tier-3, from 1 USD on Tier-1 | 50-250 USD by network | Cheapest volume available |
| Direct click | CPM from 1.50 USD | 150 USD | The network claims a 10x higher CR versus intent-based formats |
| Telegram Mini App Ads | CPC from 0.015 USD | 150 USD | Top GEOs include Ukraine and Nigeria |
| Telegram Ads (official) | CPM from EUR 0.70 | EUR 250 | With 20% reseller commission and 22% VAT the real entry is EUR 366 |
Telegram Ads cut its minimum CPM from EUR 1 to EUR 0.70 in general categories in February 2026, and to EUR 0.35 in the politics and events category. Targeting specific channels, bots or search stayed at EUR 1. Media formats rose less than the base rate: EUR 1.05 for an image, EUR 1.19 for video and GIF, a 50-70% premium on the new floor.
Push and pop network minimums remain the lowest barrier to entry anywhere in the market: Adsterra, PropellerAds, TrafficStars and Clickadu start at 100 USD, HilltopAds and EZmob at 50, PopCash at 5.
SEO and organic
Organic delivers the best ROI over distance and the worst Cash ROI at the start. A guest post on a DR 50+ donor runs 500-800 USD, niche edits from 500-600 USD, and a realistic monthly budget for a new project is 5,000-15,000 USD. On timelines: long-tail terms reach page two or three in 3-6 months, mid-tail reaches page one in 6-12, and top three on head terms takes 18-24 months.
One regulatory note for paid search. New Google Ads gambling certification forms go live on 26 August 2026, requiring a valid local licence for every target region plus documentation linking the advertising entity to the licensee. Affiliates and aggregators must link exclusively to authorised gambling entities and confirm this in the footer. A single account can no longer hold online gambling and social casino certifications at the same time.
Scaling without giving back the ROI
Scaling is the most reliable way to kill a profitable campaign. ROI decays non-linearly as budget rises, yet the decision to raise budget almost always gets made on the campaign average.
Marginal ROAS
A media analysis published 10 May 2026 puts real numbers on it: a campaign running 1,000 USD per day at a 3.5x average ROAS delivered 5.2x over the first ten days, 3.1x over the next ten and only 1.8x in the final stretch. In a modelled example from the same piece, raising budget from 500 to 1,500 USD per day pulled average ROAS from 4.0x to 2.1x, with marginal ROAS on the extra thousand at 0.8x. Every incremental dollar was losing money even while the campaign as a whole still looked profitable.
The fix is to judge the increment, not the average. If total profit in dollars did not grow after a budget rise, the increment is running at a loss and the budget should go back.
Pacing the increase
- Raising budget 20-30% at once resets the algorithm into learning. Safe pacing is 10-20% every 3-4 days.
- First-impression share should stay at 60-70%; below that the audience is exhausted.
- A campaign should hold positive ROI for 3-5 consecutive days before a budget rise, not one good day.
- Creative fatigue accounts for an estimated 40-60% of CPA inflation in mature campaigns, per a 10 March 2026 industry analysis whose authors describe their own figures as directional rather than precise.
“We see the same sequence over and over: a campaign holds 40% ROI at 300 USD a day, the buyer pushes it to 1,000, and within a week it is at break-even. The problem is not scale itself, it is that the decision was made on average ROI rather than on the increment. The check is simple: if profit in dollars did not rise after the budget increase, the increment is not paying for itself,” comment the SharkLink team.
Anti-patterns: how to improve ROI and lose money
An ROI figure is easy to raise without earning a dollar. These are the most common ways to fool yourself.
- Cut spend. ROI rises because the denominator shrinks. Profit in dollars falls. ROI is maximised at exactly one point: when you buy no traffic at all.
- Pick a convenient reporting window. Count revenue over 90 days and costs over 30 and the number looks excellent. Periods have to match.
- Ignore rejected conversions. The 12% line in our waterfall cost 26 points of ROI.
- Compare ROI across different horizons. A 30-day CPA campaign and a 30-day revenue share cohort are not comparable: the first has delivered its full result, the second about a sixth of it.
- Decide on twenty deposits. Per the sample table, a measured 30% there means anything from -27% to +87%.
- Ignore the cash layer. A campaign at 56% Net ROI with a 90-day hold can kill a team through a cash gap long before the money arrives.
A 30-day checklist
The sequence that adds the most ROI in a month without increasing budget.
- Week 1. Build a full campaign P&L: spend, top-up fees, accounts, proxies, antidetect, tracker, cloaker, creative, team. Calculate Net ROI instead of Gross and write down the gap.
- Week 1. Ask your affiliate manager four things in writing: the admin fee, the negative carryover policy, the hold period and the clawback window. Silence on any of them is itself an answer.
- Week 2. Reconcile your postbacks against the program’s dashboard over 30 days. Take any divergence above 15-20% to a conversation.
- Week 2. Run the capital turnover formula and check whether your “best” offer is losing to a faster-paying one.
- Week 3. Audit every live campaign for sample adequacy. Anything under fifty FTDs moves from the “result” column to the “hypothesis” column.
- Week 3. Expand the creative pool past twenty variants and hold frequency under 2.5.
- Week 4. Go into renegotiation with three specific asks: a carryover cap, a shorter hold and a volume-tiered grid. Bring numbers from your own traffic rather than a request.
Frequently asked questions
What is the correct ROI formula for affiliate traffic?
(Revenue – Costs) / Costs * 100%. Break-even under this formula is zero percent, not one hundred. Costs must include more than media spend: accounts, proxies, antidetect, tracker, cloaker, domains and creative production all belong there. Keitaro, Voluum and Binom all publish this formula in their documentation, though Keitaro’s blog also uses a ROAS scale under the ROI name.
What is a good ROI for iGaming affiliate campaigns in 2026?
No public benchmark with a disclosed methodology exists. We checked CPA networks, trade media, tracker vendors and public company filings: nobody publishes a median campaign ROI or the share of campaigns that turn a profit. The nearest reference point is a 3x-6x ROAS range on 90-day NGR from agency RedClaw, drawn from its own unaudited book, plus a working LTV-to-acquisition-cost ratio of 3:1. Read both as calibration, not as a standard.
Why is my tracker ROI higher than my actual bank balance?
Because the tracker knows nothing about rejected conversions, clawbacks, admin fees or the cost of accounts and software. In the worked model here, 120% in the tracker becomes 56.2% after a full recalculation, and 36.9% once the buyer’s profit share is applied. A gap of sixty points or more is normal rather than exceptional.
How much does an admin fee reduce revenue share earnings?
An admin fee is an operator deduction applied before your rate. Practitioners estimate the typical structure at 12-17% for game content, 3-6% for payment processing and 7-10% for the platform on white label, adding up to roughly 25%. At that level a headline 40% revenue share pays an effective 30%. Get the number written into the agreement, otherwise it can change without notice.
How does the hold period affect real returns?
Through capital turnover. On a 10,000 USD bankroll, a campaign at 35% ROI with a 7-day hold supports 13,636 USD of monthly spend and returns 4,773 USD, while one at 60% ROI with a 45-day hold supports only 5,000 USD of spend and returns 3,000. The lower ROI with the shorter hold wins by 59%.
How many FTDs before the ROI figure is reliable?
Around fifty to separate profit from loss with confidence, and a hundred before planning a scale-up against a specific number. At twenty FTDs a measured 30% ROI is statistically indistinguishable from a 27% loss. Five percent precision needs roughly four hundred conversions.
Is CPA or revenue share better for ROI?
It depends on your horizon and how fast your bankroll needs to turn over. In the model here, a hundred Tier-2 deposits at 120 USD CPA return +20% on the crediting date, while the same cohort on 30% revenue share reaches break-even in month twelve and +17.5% after two years. CPA wins where capital must recycle. Revenue share wins on brands with strong retention and in GEOs where the LTV tail runs long.
What should I do when ROI drops after scaling?
Measure the increment rather than the campaign average. If profit in dollars did not rise after the budget increase, the increment is losing money and the budget should return to its previous level. Then check frequency (above 2.5, CPM rises 15-30%), ad age (effective life is 10-14 days) and pacing (safe is 10-20% every 3-4 days).


Leave a comment
Thank you for your feedback!
Your review will be published after moderation.